

Loading…
Loading…
Oil and gas companies manage data from wells, production systems, equipment, and regulatory sources, often in different formats. This guide explores the challenges of fragmented data, industry standards, and practical strategies for building reliable data pipelines, improving data quality, and connecting existing systems.
Written by: AKM Ahsan Created on: 13 Oct 202618 min to read

Oil and gas companies depend on information from wells, production systems, equipment, land records, and regulatory agencies. But that information rarely arrives in a consistent format.
A production report from Texas may describe an entire lease. Another dataset may describe an individual well. Equipment measurements can arrive every few seconds, while regulatory production information may not become available until months later.
Put those records into one database without accounting for the differences, and the result can be misleading.
Oil and gas data management is the process of organizing, integrating, validating, securing, and maintaining industry information so it can support reliable operational, regulatory, and commercial decisions.
For operators, analysts, and companies developing energy software, the challenge is not simply storing more data. It is preserving what each source means while making different systems work together.
Oil and gas data management covers the complete lifecycle of information used in exploration, drilling, production, transportation, refining, and related business operations.
It includes collecting data from source systems, connecting records to the correct assets, checking accuracy, preserving historical changes, managing access, and making information available to applications and users.
A typical upstream data environment might contain:
These datasets were created for different purposes. They often have different owners, identifiers, measurement conventions, and update schedules.
A reliable data management system must accommodate those differences without allowing them to compromise downstream reporting.
The terms are related, but they describe different responsibilities.
| Capability | What it does |
| Data storage | Holds records in databases, object storage, or other repositories |
| Data integration | Extracts and connects information across systems |
| Data quality management | Validates completeness, accuracy, consistency, and relationships |
| Master data management | Establishes consistent identities for shared business entities |
| Data governance | Defines ownership, access, policies, and accountability |
| Data lineage | Records where information originated and how it changed |
A company can have a modern cloud data warehouse and still struggle with basic data reliability.
For example, a production dashboard might successfully retrieve monthly volumes from several sources while incorrectly assigning lease-level production to individual wells.
The storage and ingestion processes may be functioning correctly. The interpretation of the data is not.
This distinction is central to effective oil and gas data management.
Oil and gas data comes from internal operational systems, government agencies, commercial providers, equipment vendors, and business partners.
The sources vary depending on whether the business operates upstream, midstream, or downstream.
| Data category | Common records | Primary uses |
| Well and drilling | Permits, wellbores, drilling logs, completions | Well identification and drilling analysis |
| Production | Oil, gas, and water volumes, downtime, production history | Performance reporting and forecasting |
| Geological and reservoir | Seismic data, formations, reservoir models | Exploration and reservoir evaluation |
| Operational | Pressures, temperatures, flow rates, equipment status | Monitoring and maintenance |
| Land and ownership | Leases, mineral interests, ownership records | Land management and asset evaluation |
| Regulatory and environmental | Inspections, filings, permits, emissions information | Compliance and reporting |
| Commercial and financial | Costs, royalties, contracts, commodity prices | Commercial decisions and valuation |
For US energy businesses, public regulatory information is often an important part of the overall data environment.
However, public availability does not guarantee consistency.
Railroad Commission of Texas (RRC)
The RRC provides access to Texas oil and gas production information, wellbore records, drilling permits, and other regulatory datasets.
Its Production Data Query system is particularly useful for production analysis, but the reporting structure requires careful interpretation.
Source: RRC Production Data Query FAQs
Colorado Energy & Carbon Management Commission (ECMC)
Colorado publishes oil and gas information through downloadable records and data services, including well locations, production records, and GIS datasets.
Some datasets are updated on different schedules, and published metadata may identify limitations in completeness or location accuracy.
Source: Colorado ECMC Downloadable Data
US Energy Information Administration (EIA)
The EIA provides national and regional energy statistics, including petroleum and natural gas information.
Its API supports automated retrieval of energy datasets and includes documentation describing dataset frequencies, available fields, and query parameters.
EIA statistics are useful for industry analysis, but an aggregate energy series should not be treated as a substitute for an individual asset's production records.
Bureau of Safety and Environmental Enforcement (BSEE)
BSEE provides federal offshore information, including well, lease, production, and related regulatory records.
Its data resources include query tools, reports, and downloadable files.
Source: BSEE Data Center
Each source may be authoritative within its own reporting scope. That does not mean the records can be combined without transformation and interpretation.
Several technical challenges distinguish oil and gas data from ordinary business datasets.
The most important involve reporting granularity, identifiers, measurement context, historical corrections, and source-system differences.
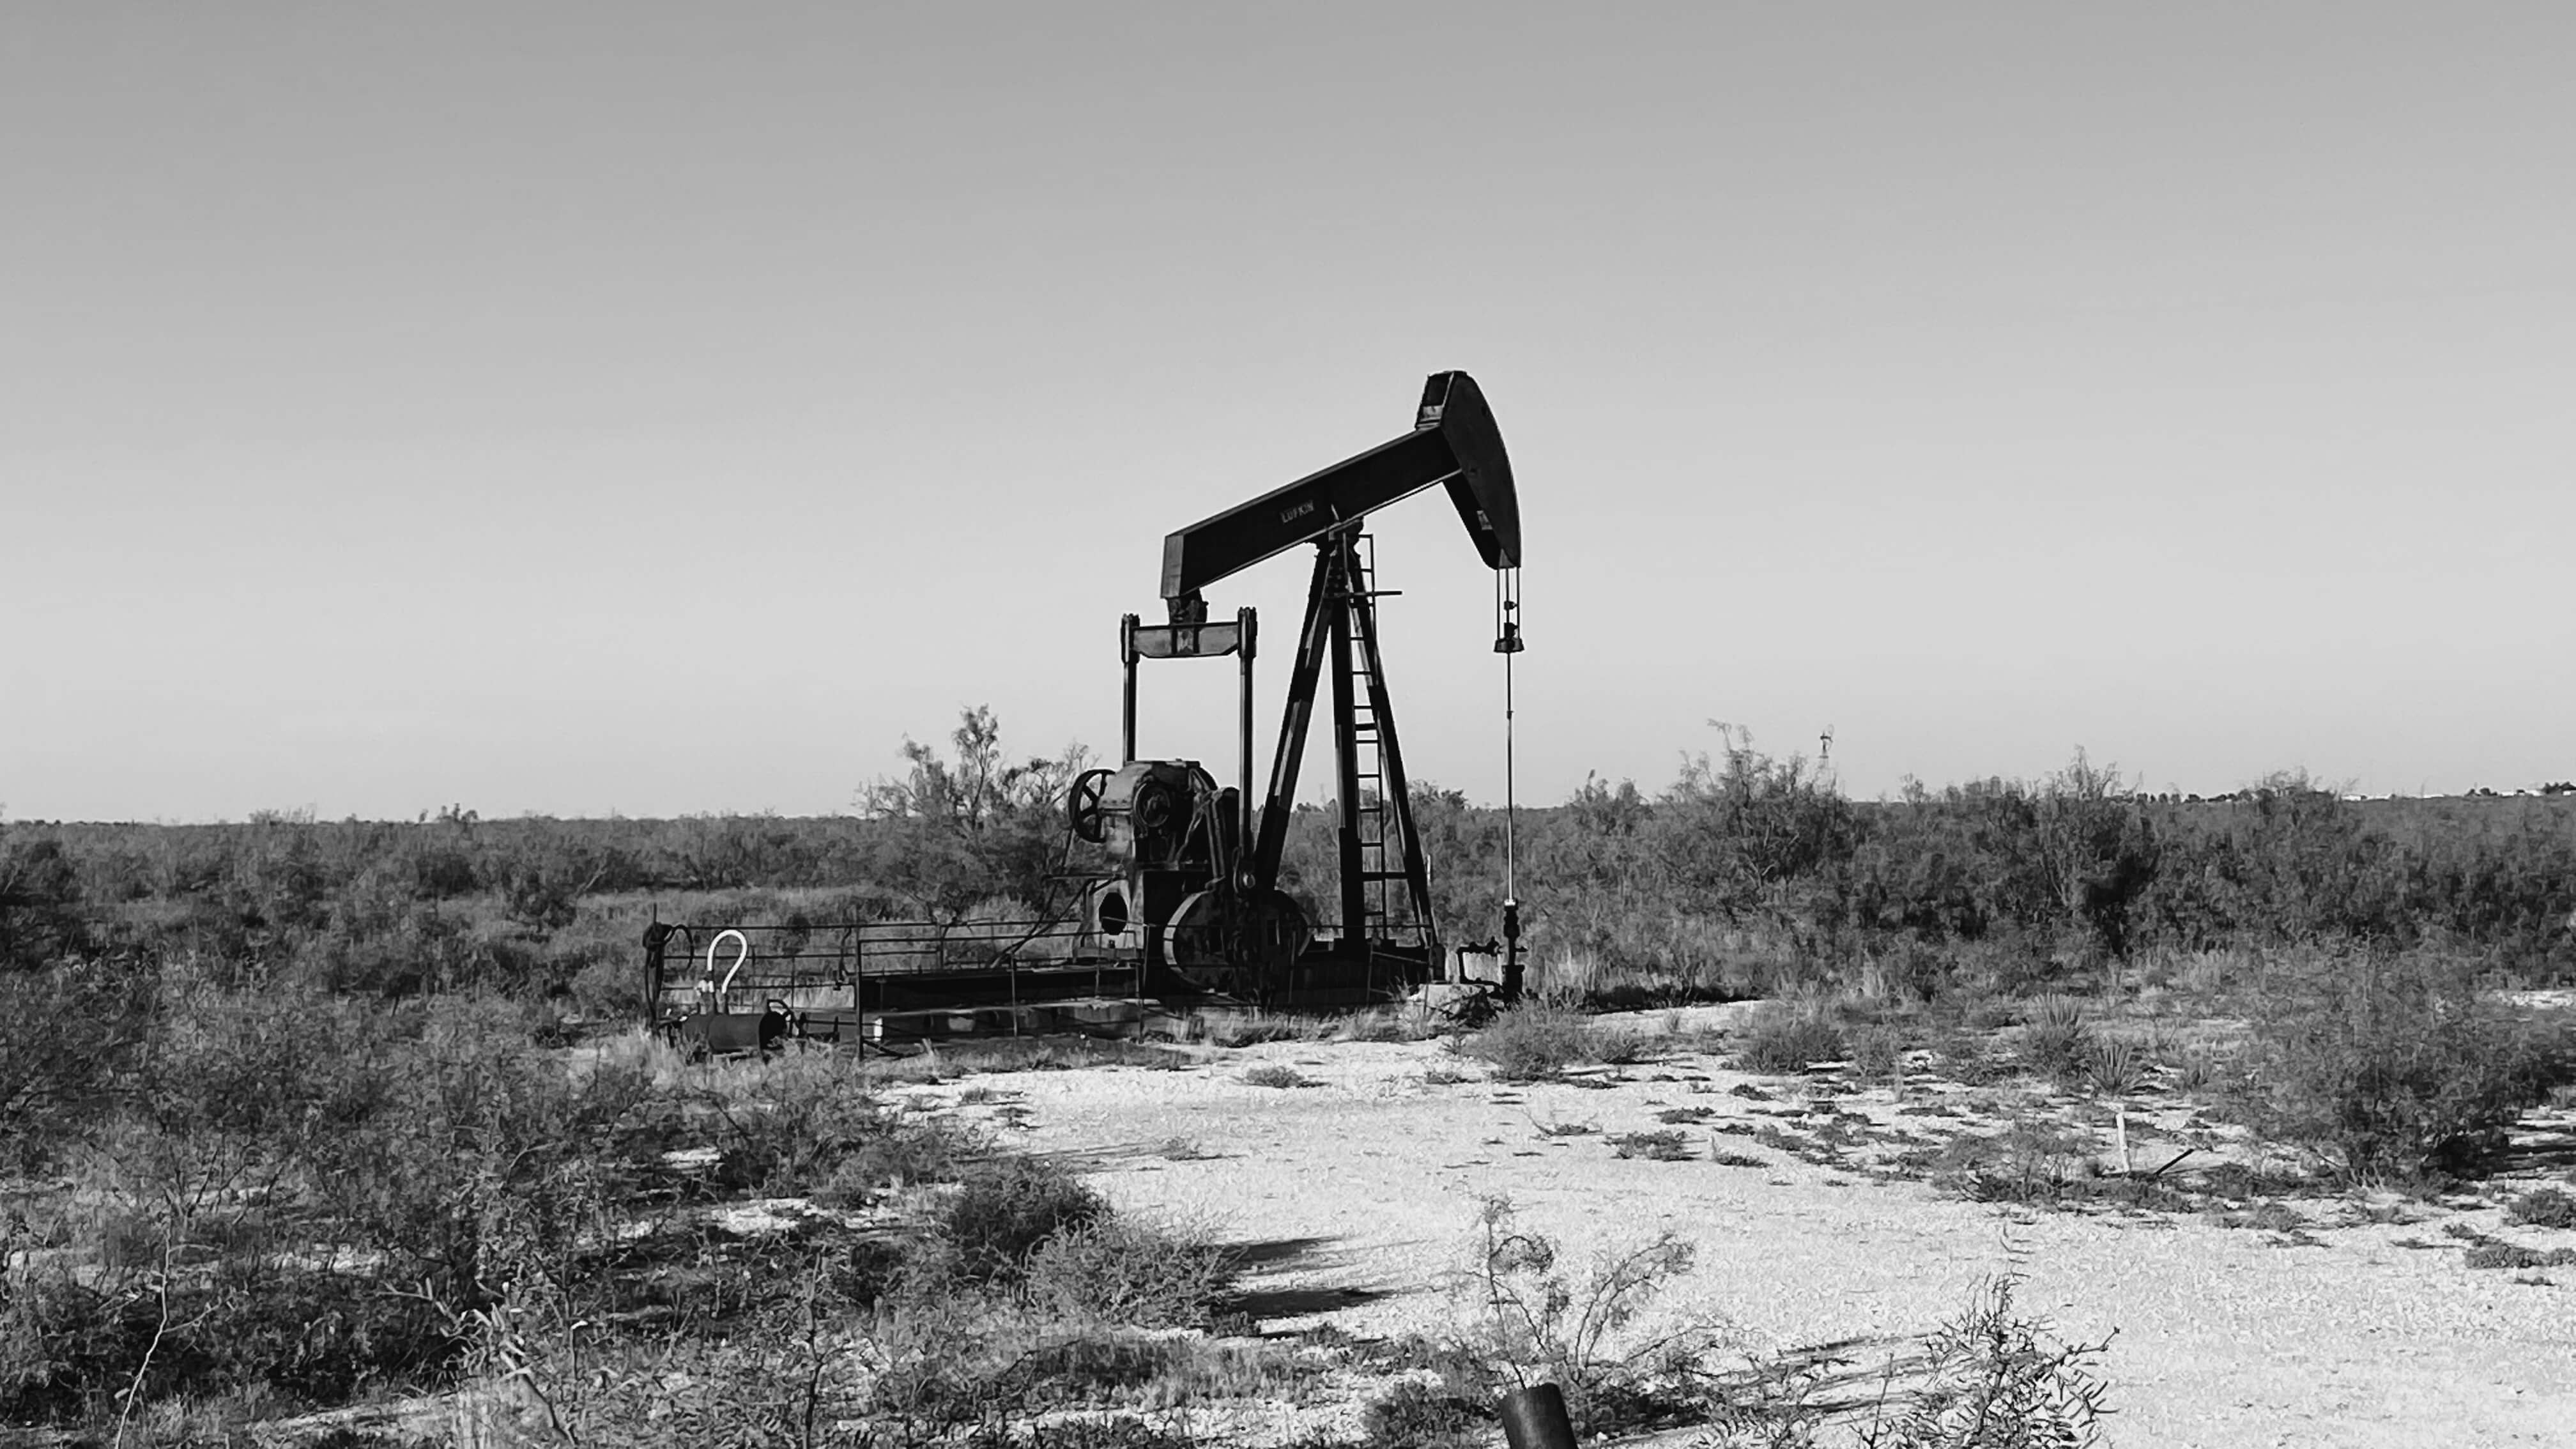
Suppose a software company is building a production analytics platform using data from multiple US states.
The initial design might assume that every production record belongs to an individual well.
That assumption would create problems in Texas.
According to the Railroad Commission of Texas, production is reported by lease. An oil lease can contain multiple oil wells, while a gas lease contains one gas well.
The RRC also explains that its online production information generally has a two-month reporting lag and can change when corrected or late reports are received.
These are not minor formatting differences.
They affect the meaning of the data.
Illustrative example
Consider a Texas oil lease containing three producing wells and reporting 9,000 barrels for a month.
The lease-level production figure is 9,000 barrels.
Without a documented allocation methodology, the system cannot conclude that each well produced 3,000 barrels.
Dividing the total equally would manufacture well-level information that the source did not provide.
A reliable system preserves the lease-level measurement and records any separate allocation as a derived value, together with its method and assumptions.
This distinction matters for asset analysis, production comparisons, and forecasting.
A well can appear in several systems:
Those systems may refer to different aspects of the well.
The PPDM Association's What Is a Well? framework distinguishes between wells, well origins, wellbores, wellbore segments, completions, and reporting streams.
For example, one physical well can contain multiple wellbores or completions.
A production record linked to a completion should not automatically be treated as equivalent to a record covering the entire well.
For data engineering teams, this creates a master data problem.
A reliable implementation needs to maintain relationships between identifiers rather than assuming one identifier represents every associated entity.
An oil and gas platform may receive:
These values cannot always be compared directly.
For example, an hourly gas flow measurement is not equivalent to a monthly reported production volume.
The system must account for measurement periods, units, operating conditions, and any calculations used to derive totals.
Simply converting everything into a common numerical format can hide important differences.
The data model should preserve the original measurement and its context.
Production data can change after its initial publication.
Late submissions, corrected reports, revised asset classifications, and source-system adjustments can all affect previously retrieved records.
An ingestion pipeline that only imports new records may therefore become increasingly inaccurate.
Reliable pipelines need a process for identifying and processing historical changes.
That may involve revisiting recent reporting periods, comparing source records with stored versions, updating affected values, and retaining an audit trail.

Energy companies often depend on specialized applications that cannot easily be replaced.
An operator may use a historian for equipment information, a separate application for production accounting, another platform for regulatory reporting, and spreadsheets for reconciliation.
These systems may perform their individual functions well.
The difficulty is connecting them.
Manual exports and spreadsheet-based transformations often become the integration layer.
As the business grows, those processes introduce delays, duplicate work, and dependencies on individual employees.
Replacing every application is rarely the only option. A targeted data integration layer may address the underlying problem while preserving the existing systems.
A useful architecture separates source-specific differences from the data that downstream applications consume.
For many oil and gas use cases, this means implementing three logical layers.
The raw layer preserves information as received.
Records may arrive through APIs, database connections, SFTP transfers, CSV files, spreadsheets, or other authorized interfaces.
Retaining source information makes it possible to investigate errors and reprocess historical records when transformation rules change.
Useful metadata includes the source name, retrieval time, file or batch identifier, and original reporting period.
The standardized layer converts source-specific records into consistent structures.
This is where engineering teams establish relationships, normalize supported units, validate required fields, and identify inconsistent records.
For example, two regulatory sources may use different field names for a well identifier.
The standardized model can map those fields to a common concept while preserving the original identifiers.
A critical rule is to standardize the representation without changing the underlying meaning.
Lease production must remain lease production. A completion-level measurement must remain associated with the appropriate completion.
The business-ready layer provides information for applications, dashboards, reporting tools, and analytical workflows.
Examples include production-history views, asset-performance reports, GIS applications, and regulatory reporting interfaces.
These applications should not need to understand every source-specific field name or ingestion format.
That complexity belongs in the data engineering layer.
The following is an illustrative reference architecture, not a claim about any specific client deployment.
REGULATORY & OPERATIONAL SOURCES
      |
      | APIs / SFTP / CSV / Excel / Databases
      v
INGESTION PIPELINES
      |
      | Scheduling / retries / failure handling
      v
RAW DATA STORAGE
      |
      | Source snapshots / metadata / provenance
      v
STANDARDIZATION & VALIDATION
      |
      | Identifier mapping / unit handling
      | Reporting-grain checks / reconciliation
      v
CURATED DATA STORE
      |
      | Well / lease / production relationships
      v
APPLICATIONS & ANALYTICS
      |
      +-- Production dashboards
      +-- Regulatory reporting
      +-- GIS applications
      +-- Operational analytics
Monitoring, access controls, and lineage tracking should apply throughout the architecture rather than being added only at the final application layer.
A technically sound architecture still needs operational controls.
The following practices address common failures in production data pipelines.
The reporting grain identifies what one record represents.
For example:
This information should be explicit in the data model.
If the reporting grain is unknown, the system cannot reliably determine whether two values can be compared or combined.
Create documented relationships between source identifiers and the relevant well, completion, lease, facility, or other entity.
Do not discard original source identifiers after mapping them.
A master registry should also support identifier changes and relationships that vary over time.
External sources may publish the same data more than once.
Pipelines should be able to reprocess information without unintentionally creating duplicates.
This commonly requires a stable source-specific record key, clear update rules, and idempotent processing.
A reconciliation check should compare values that describe the same entity, measurement, unit, and time period.
For example, compare a lease-level monthly production total with the corresponding lease-level source value.
Do not label a mismatch as an error when the two figures represent different reporting scopes.
A dataset may be complete for all finalized historical periods but unavailable for the current month.
Conversely, a source may have been ingested recently but contain missing historical records.
Tracking freshness and completeness separately helps distinguish expected reporting delays from pipeline failures.
Important analytical values should be traceable to their original sources.
A useful record of lineage includes the source, ingestion batch, applicable transformation, and timing of any updates.
This allows teams to explain why historical figures changed rather than treating every revised value as an unexplained discrepancy.
Before selecting software or rebuilding an integration, document the sources involved in the business workflow.
The following checklist provides a practical starting point.
| Area | What to confirm |
| Source ownership | Who maintains the system or publishes the dataset? |
| Access method | API, database connection, SFTP, file download, or another interface? |
| Asset identifiers | How are wells, leases, completions, and facilities identified? |
| Reporting grain | What does one record represent? |
| Measurement context | Which units, periods, and operating conditions apply? |
| Update schedule | How often does the source publish new information? |
| Reporting lag | How long after the operational period does information become available? |
| Historical changes | Can records be corrected or replaced? |
| Data quality | Which fields are missing, inconsistent, or unreliable? |
| Business dependencies | Which reports, applications, and decisions use the data? |
| Access and security | What permissions, contractual conditions, or restrictions apply? |
| Failure handling | How are incomplete loads, schema changes, and reconciliation errors detected? |
This inventory helps identify whether the main problem is missing information, poor data quality, unreliable integration, or an unsuitable data model.
Those problems require different solutions.
If your systems already contain the information you need, but pipelines fail, records do not reconcile, or reporting still depends on manual work, 6sense HQ's Energy Data Engineering Services focus on improving the engineering between existing systems rather than replacing everything.
Industry standards can improve interoperability, but they address different aspects of data management.
The right standard depends on the information being managed and the systems that need to exchange it.
| Standard | Primary purpose | When it is useful |
| PPDM | Petroleum data models, terminology, and master data | Establishing consistent asset identities and relationships |
| OSDU | Energy data platform architecture and services | Managing, discovering, and sharing energy data across applications |
| WITSML | Well-related information exchange | Drilling, logging, completions, and intervention workflows |
| PRODML | Production-domain information exchange | Production reporting, surveillance, and optimization |
| RESQML | Subsurface and reservoir information exchange | Geological interpretation, reservoir modeling, and simulation |
The PPDM Association develops petroleum data models and terminology.
Its PPDM 3.9 relational data model covers more than 60 subject areas and is designed to support petroleum data management and application development.
PPDM concepts are particularly useful where multiple systems need consistent definitions for shared assets.
Source: PPDM 3.9 Data Model
The OSDU Data Platform provides services and architectural conventions for managing energy data.
Its storage documentation describes schema-based records and the relationship between schemas and searchable information.
An OSDU-based implementation can support shared access to information, but it still requires properly mapped and validated source data.
Energistics maintains standards for exchanging specialized upstream information.
WITSML is oriented toward well-related operations, PRODML toward production information, and RESQML toward subsurface and reservoir modeling.
These are particularly valuable when the application must exchange technical records with specialized petroleum software.
Source: Energistics Standards
Not every oil and gas data project needs to implement all these standards.
A platform consolidating public state regulatory datasets may primarily need source-specific ETL, a consistent internal data model, and reliable reconciliation.
An application exchanging drilling and geological information with specialist engineering software may have different requirements.
Standards should support the workflow, not become the starting point of the project.
Multi-state regulatory data is a useful example of how a data management problem becomes a software engineering problem.
Peak ETL, a Colorado-based oil and gas data business, wanted to make industry information more accessible to smaller operators, landmen, analysts, and other users.
The underlying information existed, but retrieving it required dealing with multiple regulatory sources, inconsistent formats, and fragmented workflows.
Working with Peak ETL, 6sense HQ developed Spud Wire, a map-first oil and gas data platform.
The platform's data integration architecture supports sources delivered through SFTP, web scraping, Excel, and CSV formats.
Rather than forcing every state source into the same retrieval process, the architecture accommodates differences at the ingestion layer.
The platform brings together four core data categories:
A shared map-first interface makes related data easier to explore geographically.
A system built around one state's record format can become difficult to maintain when new jurisdictions are introduced.
Spud Wire was designed with an adaptable architecture so additional state data formats could be incorporated without rebuilding the entire platform.
The case study describes an architecture targeting nationwide coverage; that should not be confused with independently verified completeness of every record across all 50 states.
Displaying large numbers of geographic records presents its own engineering challenges.
The team used an open-source-oriented GIS approach to balance mapping functionality with operating costs.
This mattered because the product was intended to make data intelligence accessible beyond the traditional high-cost enterprise market.
The value of the engineering was not simply the ability to store more records.
It was the separation of source-specific data complexities from the interface that users depended on.
The published case study describes Spud Wire as a live platform and documents early user demonstrations and product validation.
Peak ETL's owner also provided a verified Clutch review confirming delivery of a working UI and responsive development support.
The project illustrates how targeted ETL architecture, domain-specific data modeling, and GIS engineering can turn fragmented source information into a usable software product.
Even well-funded modernization projects can struggle when the engineering approach does not match the actual data problem.
A dashboard can expose information. It cannot determine whether the underlying figures are comparable.
Establish source definitions, validation rules, and reconciliation processes before relying on dashboard outputs for important decisions.
An absent record may reflect delayed reporting, missing source information, or an ingestion failure.
It does not automatically mean an asset produced nothing.
Data systems should distinguish missing information from a reported zero value.
Replacing original identifiers with a single internal key can make it difficult to reconcile records later.
Maintain source identifiers alongside standardized relationships and keep a record of the mapping decisions.
A job can complete without error and still load incomplete or incorrectly mapped information.
Pipeline monitoring should cover data quality and reconciliation, not only job execution.
A new data warehouse or business intelligence tool will not automatically resolve conflicting identifiers or incorrect transformations.
Before replacing operational applications, determine whether the problem can be solved through a better integration and validation layer.
An oil and gas data management initiative needs measurable outcomes.
Useful metrics include:
| Metric | What it reveals |
| Data completeness | Whether expected records and required fields are available |
| Data freshness | How quickly available source information reaches the target system |
| Entity matching accuracy | Whether records connect to the correct wells, leases, and other assets |
| Reconciliation accuracy | Whether comparable source and target figures agree |
| Pipeline reliability | Whether scheduled ingestion processes complete correctly |
| Exception resolution time | How quickly teams investigate and resolve data quality problems |
| Manual processing effort | How much recurring extraction and reconciliation work remains |
These metrics should be interpreted in context.
For example, delayed publication by a regulator should not automatically count as an internal engineering failure.
The system should distinguish between data that has not yet been published and data that was available but not successfully ingested.
Similarly, greater automation is only a benefit when the automated process preserves the reliability of the underlying information.
Organizations do not need to modernize every data system at once.
A targeted approach is often easier to validate and maintain.
Start with a business process that has a clear consequence.
Examples include recurring production reporting, regulatory imports, asset reconciliation, or a data feed that frequently breaks when its source changes format.
Identify the systems involved, the manual work required, and the specific failure points.
Measure the current level of completeness, processing effort, delay, and reliability.
Document important source definitions and identify where information becomes inconsistent.
This provides a reference for evaluating the improvement.
Implement or improve the integration, mapping, validation, and monitoring required for that workflow.
Preserve the existing systems where they remain useful.
Compare outputs with the original sources.
Test historical corrections, duplicate records, missing values, delayed reports, and unexpected format changes.
Only expand to additional sources after the initial workflow produces dependable results.
Standardize reusable ingestion patterns, validation controls, and asset relationships.
This reduces the engineering effort required to introduce additional data sources.
Oil and gas data management is not primarily a storage problem.
It is a problem of connecting systems that describe different assets, measurements, periods, and business processes.
A reliable approach starts by understanding the source information. It preserves original records, establishes consistent relationships, validates transformations, and tracks changes over time.
For companies developing oil and gas applications or modernizing operational reporting, the most valuable improvement may be a better data pipeline rather than a completely new platform.
Start with the information that supports an important business decision. Identify where its meaning or reliability is being lost. Then fix that part of the data flow before expanding.
The objective is simple: make data dependable enough that people can spend less time questioning the numbers and more time using them.